
The Architecture
of Legibility
Data is not information until it is structured for a specific decision. At Bekaroxz, we replace chaotic dashboards with disciplined visual reporting and briefing dossiers designed for rapid executive synthesis.
Signal Isolation
We strip away secondary noise. By focusing on core performance indicators, we ensure the "critical few" metrics are never obscured by the "trivial many."
Relative Benchmarking
A number in isolation is a guess. Every data point in our visual reporting system includes historical trajectory and forecast variance to provide immediate meaning.
Response Triggers
Our dashboard strategy links visualization to execution. When a threshold is breached, the visual system directs the eye toward the necessary corrective workflow.
Designing for
Cognitive Speed
Information pressure refers to the volume of data an executive must process. Our briefing dossier formats use deliberate documentation seams to organize this pressure, allowing for tiered reading experiences.
- Phase A / Diagnostic Layer
- Phase B / Variance Analysis
- Phase C / Forensic Detail

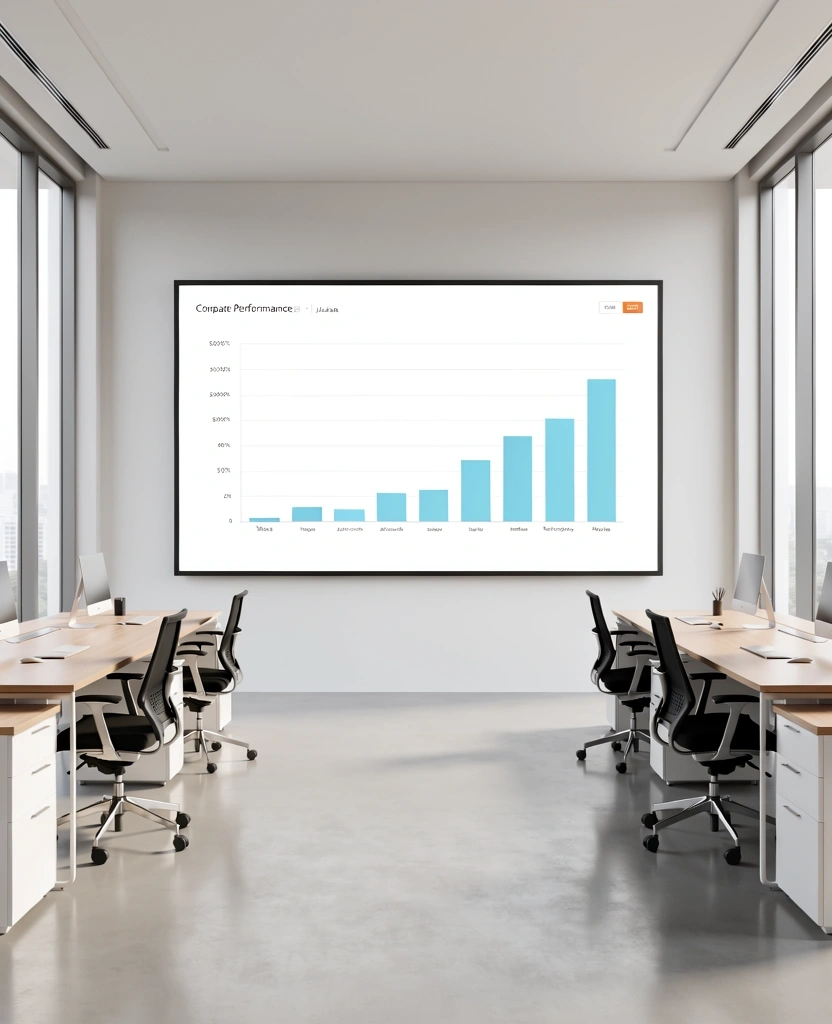
FIG 1.0 // EXECUTIVE SUMMARY COMPARTMENT

FIG 2.0 // INTERACTIVE METRIC DRILL DOWN
Implementation Protocol
Audit & Inventory
We begin by identifying every data source currently in use. We evaluate the validity of existing metrics and prune redundant indicators that fail to drive decision-making.
Hierarchical Mapping
The framework is mapped to your specific organizational chart. Performance indicators are tiered from operational levels up to boardroom summaries, ensuring alignment at every seam.
Visual Translation
Final engineering of the briefing dossier. We select specific visualization modes—from water-fall variance charts to density heatmaps—optimized for the specific metric behavior.